California Mobile Home Park Statistics

2026 California Mobile Home Parks Statistics
California Department of Housing and Community Development (HCD)
Mon, Feb 2, 2026 – According to data obtained from the California Department of Housing and Community Development (HCD), there are 5,224 Active Mobile Home and RV Parks totaling 452,082 lots/spaces in the State of California. Of those 452,082 lots/spaces, 361,316 are mobile home spaces, 68,135 are RV lots with drains, and 22,631 are RV lots without drains.
There are 730 Closed Mobile Home and RV Parks totaling 21,212 lots/spaces. Of those 21,212 lots/spaces, 11,975 are mobile home spaces, 6,482 are RV lots with drains, and 2,755 are RV lots without drains.
As of Mon, Feb 2, 2026, the HCD has data for a total of 5,954 Mobile Home and RV Parks totaling 473,294 lots/spaces which includes Active and Closed listings. Of those 473,294 lots/spaces, 373,291 are mobile home spaces, 74,617 are RV lots with drains, and 25,386 RV lots without drains.
HCD Note: HCD has enforcement of 81.4 percent of the parks and 75.5 percent of the lots in the State of California. The overall average park size is 86 lots; 80 for Mobile Home Parks, and 88 for RV Parks.
The Closure of 500+ California Mobile Home Parks – 2026 Updates
Tue, Mar 6, 2026 – In March of 2015, Katie Kramon from the Peninsula Press wrote an article titled, “California’s Affordable Mobile Home Parks Vanishing.” In that article, Katie’s research revealed that between the years 2005–2015, “4,792 mobile home lots had vanished from the map according to data obtained from the California Department of Housing and Community Development (HCD). Over 400 mobile home parks have closed in the State of California over the last 20 years (1995-2015).”
The MHPHOA recently received 2025 park closure information for the State of California which was provided by an anonymous housing advocate. Over the last nine years (2016–2025), 102 mobile home parks have closed containing an estimated 4,553 lots based on data from the HCD. Los Angeles County had the most closed parks totaling 15. Katie Kramon’s data from 2005–2015, stated 4,792 lots closed. That totals 9,345 lots closed between 2005–2025. Over 500 parks have closed in the State of California over the last 30 years (1995–2025).
Note: HCD data (all time) shows the closure of 11,975 mobile home spaces.
Methodology for Park Closure Analysis
- Compared “closed” parks from two point-in-time snapshots: October 2016 and November 2025. Snapshots were selected for their availability.
- Removed RV parks from data.
- Included all parks in the data where there were 2 or more MH lots. Also included parks where there is no data on lots but where there is neither “RV” nor “campground” in the name of the park.
- Imputed number of MH spaces by replacing blanks in the data with average of MH lots per park (42) for parks with data provided.
The below Top 10 Largest Mobile Home and RV Park listings in California are based on the HCD Mobile Home and RV Parks Active Listings as of Mon, Feb 2, 2026.
California – Top 10 Largest Mobile Home Parks
| # | Mobile Home Park Name | Address | City | ST | Zip | SPC |
|---|---|---|---|---|---|---|
| Casa de Amigos Operated By: Casa de Amigos Ltd |
1085 Tasman Dr | Sunnyvale | CA | 94089 | 923 | |
| Plaza del Rey Operated By: Plaza del Rey Owner LLC |
1225 Vienna Dr | Sunnyvale | CA | 94089 | 800 | |
| Hemet West Mobile Estates Operated By: Western States Mobilehome Parks |
5001 W Florida Ave | Hemet | CA | 92545 | 771 | |
| Westwinds Operated By: MHC Operating LP |
500 Nicholson Ln | San Jose | CA | 95134 | 723 | |
| Swan Lake Mobile Home Park Operated By: Hamner Park Associates |
5800 Hamner Ave | Eastvale | CA | 91752 | 716 | |
| Los Alisos Mobile Home Estates Operated By: Miller, Willis Ranch Co |
772 Garden Grove Blvd | Westminster | CA | 92683 | 705 | |
| Casa Del Lago Mobile Home Park Operated By: San Jose Investments Ltd |
2151 Old Oakland Rd | San Jose | CA | 95131 | 618 | |
| Adobe Wells Operated By: Mobilehome Communities |
1220 Tasman Dr | Sunnyvale | CA | 94089 | 613 | |
| Oakridge Mobile Home Park Operated By: Oakridge Ltd |
15455 Glenoaks Blvd | Sylmar | CA | 91342 | 600 | |
| Plantation on the Lake Operated By: Plantation Company LLC |
10961 Desert Lawn Dr | Calimesa | CA | 92320 | 557 | |
| 7,026 |
California – Top 10 Largest RV Parks With Drains
| # | RV Park Name | Address | City | ST | Zip | Lots |
|---|---|---|---|---|---|---|
| Golden Village Palms RV Resort Operated By: GVP LLC |
3600 W Florida Ave | Hemet | CA | 92544 | 1,019 | |
| Silent Valley Club Operated By: Silent Valley Club Inc |
46305 Poppet Flats Rd | Banning | CA | 92220 | 850 | |
| Caliente Springs RV Park Operated By: Timothy Manthei |
70200 Dillon Rd | Desert Hot Springs | CA | 92240 | 677 | |
| Soledad Canyon Operated By: MHC TT Inc |
4700 Crown Valley Rd | Acton | CA | 93510 | 641 | |
| Fountain of Youth Spa Operated By: Fountain of Youth Spa Corp |
1500 Spa Rd | Niland | CA | 92257 | 615 | |
| Wilderness Lakes Operated By: MHC NAC Inc |
30605 Briggs Rd | Menifee | CA | 92584 | 523 | |
| Sands RV Resort Operated By: Sun Sands RV LLC |
16400 Bubbling Wells Rd | Desert Hot Springs | CA | 92240 | 507 | |
| Mountain Lakes Operated By: Robert Burlingame |
277 Lytle Creek Rd | Lytle Creek | CA | 92358 | 494 | |
| Rivers Edge RV Resort Operated By: Brenda Agular |
2299 Winterhaven Rd | Winterhaven | CA | 92283 | 480 | |
| Catalina RV Spa Operated By: Catalina Spa & RV Inc |
18800 Cork Hill Rd | Desert Hot Springs | CA | 92240 | 477 | |
| 6,283 |
California – Top 10 Largest RV Parks Without Drains
| # | RV Park Name | Address | City | ST | Zip | Lots |
|---|---|---|---|---|---|---|
| Lawsons Landing Operated By: Carl Vogler |
137 Marine View Dr | Dillon Beach | CA | 94929 | 1,000 | |
| Calaveras Timber Trails Association Operated By: Calaveras Timber Trails Association |
1071 Avery Sheep Ranch Rd | Avery | CA | 95224 | 500 | |
| Lake of The Springs Operated By: MHC TT Inc |
14152 Frenchtown Rd | Oregon House | CA | 95962 | 465 | |
| Holcomb Valley Ranch Operated By: Holcomb Camp |
34300 Holcomb Valley Rd | Fawnskin | CA | 92333 | 400 | |
| Soledad Canyon Operated By: MHC TT Inc |
4700 Crown Valley Rd | Acton | CA | 93510 | 385 | |
| De Anza Campland Operated By: Campland on the Bay |
2211 Pacific Beach Dr | San Diego | CA | 92109 | 339 | |
| Thousand Trails Pio Pico Operated By: Thousand Trails Vehicle Park |
14615 Otay Lakes Rd | Jamul | CA | 91935 | 336 | |
| Morgan Hill Preserve Operated By: MHC TT Inc |
12895 Uvas Rd | Morgan Hill | CA | 95037 | 298 | |
| Annetts Mono Village Operated By: Annetts Mono Village Inc |
13425 Twinlakes Rd | Bridgeport | CA | 93517 | 281 | |
| Lake Minden Operated By: MHC NAC LP |
1256 Marcum Rd | Nicolaus | CA | 95659 | 274 | |
| 4,278 |
California – Top 10 Largest ROC Mobile Home Parks
| # | Mobile Home Park Name | Address | City | ST | Zip | SPC |
|---|---|---|---|---|---|---|
| Palm Desert Greens Operated By: Palm Desert Greens Association |
73750 Country Club Dr | Palm Desert | CA | 92260 | 1,922 | |
| Tri Palm Estates Operated By: Tri Palm Unified Owners Association |
32851 Desert Moon Dr | Thousand Palms | CA | 92276 | 1,629 | |
| Sierra Dawn Estates Operated By: Sierra Dawn Estates Homeowners Association Inc |
950 S Lyon Ave | Hemet | CA | 92543 | 1,474 | |
| Rancho Casa Blanca Operated By: Rancho Casa Blanca Owners Association |
84136 Avenue 44 | Indio | CA | 92203 | 801 | |
| Sabre City Estates Operated By: Researching… |
Doolittle Dr | Roseville | CA | 95747 | 726 | |
| Desert Crest Operated By: Desert Crest Community Association |
69400 N Country Club Dr | Desert Hot Springs | CA | 92241 | 582 | |
| Black Lake Mobile Estates Operated By: Researching… |
234 Crosby Way | Nipomo | CA | 93444 | 555 | |
| The Groves Operated By: The Groves Homeowners Inc |
5200 Irvine Blvd | Irvine | CA | 92620 | 533 | |
| Golf Knolls Mobile Home Park Operated By: Golf Knolls Association |
29070 Camino Alba | Murrieta | CA | 92563 | 520 | |
| Rancho Carlsbad Operated By: Rancho Carlsbad Owners Association Inc |
5200 El Camino Real | Carlsbad | CA | 92008 | 504 | |
| 9,246 |
CA Department of Finance
Housing Estimates > Mobile Homes
Fri, May 1, 2026 – According to data obtained from the California Department of Finance there are 533,789 Mobile/Manufactured Homes in the State of California as of May 2026.
Note: The California Department of Housing and Community Development (HCD) reports 453,755 mobile/manufactured home and RV spaces.
The California Department of Finance reports 533,789 mobile/manufactured homes and RV spaces. There is a difference of 80,034 between the two datasets.
| # | County | DOF 2025 | HCD 2025 |
|---|---|---|---|
| Alameda | 7,609 | 6,277 | |
| Alpine | 28 | 149 | |
| Amador | 1,387 | 2,401 | |
| Butte | 10,645 | 6,154 | |
| Calaveras | 2,107 | 2,206 | |
| Colusa | 735 | 578 | |
| Contra Costa | 7,061 | 6,686 | |
| Del Norte | 2,393 | 3,460 | |
| El Dorado | 3,992 | 4,629 | |
| Fresno | 14,006 | 8,188 | |
| Glenn | 1,397 | 717 | |
| Humboldt | 5,726 | 4,914 | |
| Imperial | 6,750 | 6,684 | |
| Inyo | 2,483 | 2,228 | |
| Kern | 21,753 | 13,616 | |
| Kings | 1,892 | 1,116 | |
| Lake | 7,560 | 4,466 | |
| Lassen | 2,114 | 1,131 | |
| Los Angeles | 56,246 | 51,124 | |
| Madera | 3,111 | 1,808 | |
| Marin | 1,883 | 2,822 | |
| Mariposa | 2,153 | 533 | |
| Mendocino | 5,360 | 4,220 | |
| Merced | 5,353 | 2,937 | |
| Modoc | 792 | 281 | |
| Mono | 986 | 1,688 | |
| Monterey | 5,537 | 4,850 | |
| Napa | 3,657 | 4,630 | |
| Nevada | 2,993 | 2,851 | |
| Orange | 32,161 | 30,440 | |
| Placer | 4,183 | 4,652 | |
| Plumas | 2,041 | 2,590 | |
| Riverside | 75,793 | 49,278 | |
| Sacramento | 14,412 | 13,859 | |
| San Benito | 830 | 1,486 | |
| San Bernardino | 42,027 | 36,737 | |
| San Diego | 44,346 | 45,601 | |
| San Francisco | 577 | 118 | |
| San Joaquin | 8,473 | 7,510 | |
| San Luis Obispo | 10,374 | 9,805 | |
| San Mateo | 3,061 | 3,221 | |
| Santa Barbara | 7,661 | 7,696 | |
| Santa Clara | 18,370 | 19,451 | |
| Santa Cruz | 6,641 | 6,804 | |
| Shasta | 8,368 | 6,219 | |
| Sierra | 84 | 130 | |
| Siskiyou | 3,204 | 2,908 | |
| Solano | 4,456 | 4,486 | |
| Sonoma | 10,837 | 10,645 | |
| Stanislaus | 8,214 | 6,557 | |
| Sutter | 1,446 | 1,602 | |
| Tehama | 5,946 | 2,378 | |
| Trinity | 1,984 | 1,341 | |
| Tulare | 9,985 | 5,655 | |
| Tuolumne | 3,318 | 3,066 | |
| Ventura | 10,871 | 10,713 | |
| Yolo | 3,551 | 3,370 | |
| Yuba | 2,866 | 2,093 | |
| California | 533,789 | 453,755 |
CA Congressional Districts
Fri, Mar 15, 2024 – According to data obtained from the NMHOA, here is a list of the 52 Congressional Districts in California along with the Counties represented. We’ve highlighted the top 10 California Congressional Districts by MH Lots in green. Click/Tap columns to sort the data. Click/Tap # column to reset.
| # | Dis | Counties | MH Lots |
|---|---|---|---|
| 1 | Butte, Colusa, Glenn, Lassen, Modoc, Shasta, Siskiyou, Sutter, Tehama, Yuba | 33,880 | |
| 2 | Del Norte, Humboldt, Marin, Mendocino, San Francisco, Sonoma, Trinity | 17,757 | |
| 3 | Alpine, El Dorado, Inyo, Mono, Nevada, Placer, Plumas, Sacramento, Sierra, Yuba | 16,465 | |
| 4 | Lake, Napa, Solano, Sonoma, Yolo | 19,960 | |
| 5 | Amador, Calaveras, El Dorado, Fresno, Madera, Mariposa, Stanislaus, Tuolumne | 16,545 | |
| 6 | Sacramento | 6,154 | |
| 7 | Sacramento, Solano, Yolo | 7,390 | |
| 8 | Contra Costa, Solano | 5,250 | |
| 9 | Contra Costa, San Joaquin, Stanislaus | 7,873 | |
| 10 | Alameda, Contra Costa | 3,684 | |
| 11 | San Francisco | 355 | |
| 12 | Alameda, San Francisco | 1,485 | |
| 13 | Fresno, Madera, Merced, San Joaquin, Stanislaus | 14,898 | |
| 14 | Alameda | 5,271 | |
| 15 | San Francisco, San Mateo | 2,283 | |
| 16 | San Mateo, Santa Clara | 8,089 | |
| 17 | Alameda, Santa Clara | 7,638 | |
| 18 | Monterey, San Benito, Santa Clara, Santa Cruz | 8,651 | |
| 19 | Monterey, San Luis Obispo, Santa Clara, Santa Cruz | 13,016 | |
| 20 | Fresno, Kern, Kings, Tulare | 19,668 | |
| 21 | Fresno, Tulare | 8,683 | |
| 22 | Kern, Kings, Tulare | 15,465 | |
| 23 | Kern, Los Angeles, San Bernardino | 20,346 | |
| 24 | San Luis Obispo, Santa Barbara, Ventura | 16,796 | |
| 25 | Imperial, Riverside, San Bernardino | 44,570 | |
| 26 | Los Angeles, Ventura | 9,305 | |
| 27 | Los Angeles | 11,479 | |
| 28 | Los Angeles, San Bernardino | 1,032 | |
| 29 | Los Angeles | 3,859 | |
| 30 | Los Angeles | 1,032 | |
| 31 | Los Angeles | 8,986 | |
| 32 | Los Angeles, Ventura | 4,167 | |
| 33 | San Bernardino | 11,607 | |
| 34 | Los Angeles | 903 | |
| 35 | Los Angeles, Riverside, San Bernardino | 10,428 | |
| 36 | Los Angeles | 1,760 | |
| 37 | Los Angeles | 714 | |
| 38 | Los Angeles, Orange | 4,219 | |
| 39 | Riverside | 10,892 | |
| 40 | Orange, Riverside, San Bernardino | 4,579 | |
| 41 | Riverside | 21,949 | |
| 42 | Los Angeles | 290 | |
| 43 | Los Angeles | 3,511 | |
| 44 | Los Angeles | 9,949 | |
| 45 | Los Angeles, Orange | 8,066 | |
| 46 | Orange | 9,613 | |
| 47 | Orange | 6,175 | |
| 48 | Riverside, San Diego | 19,773 | |
| 49 | Orange, San Diego | 8,328 | |
| 50 | San Diego | 5,679 | |
| 51 | San Diego | 5,282 | |
| 52 | San Diego | 8,182 | |
| Total Lots: | 513,931 |
MHC Owners
MH Builders
U.S. Mobile Home and RV Parks
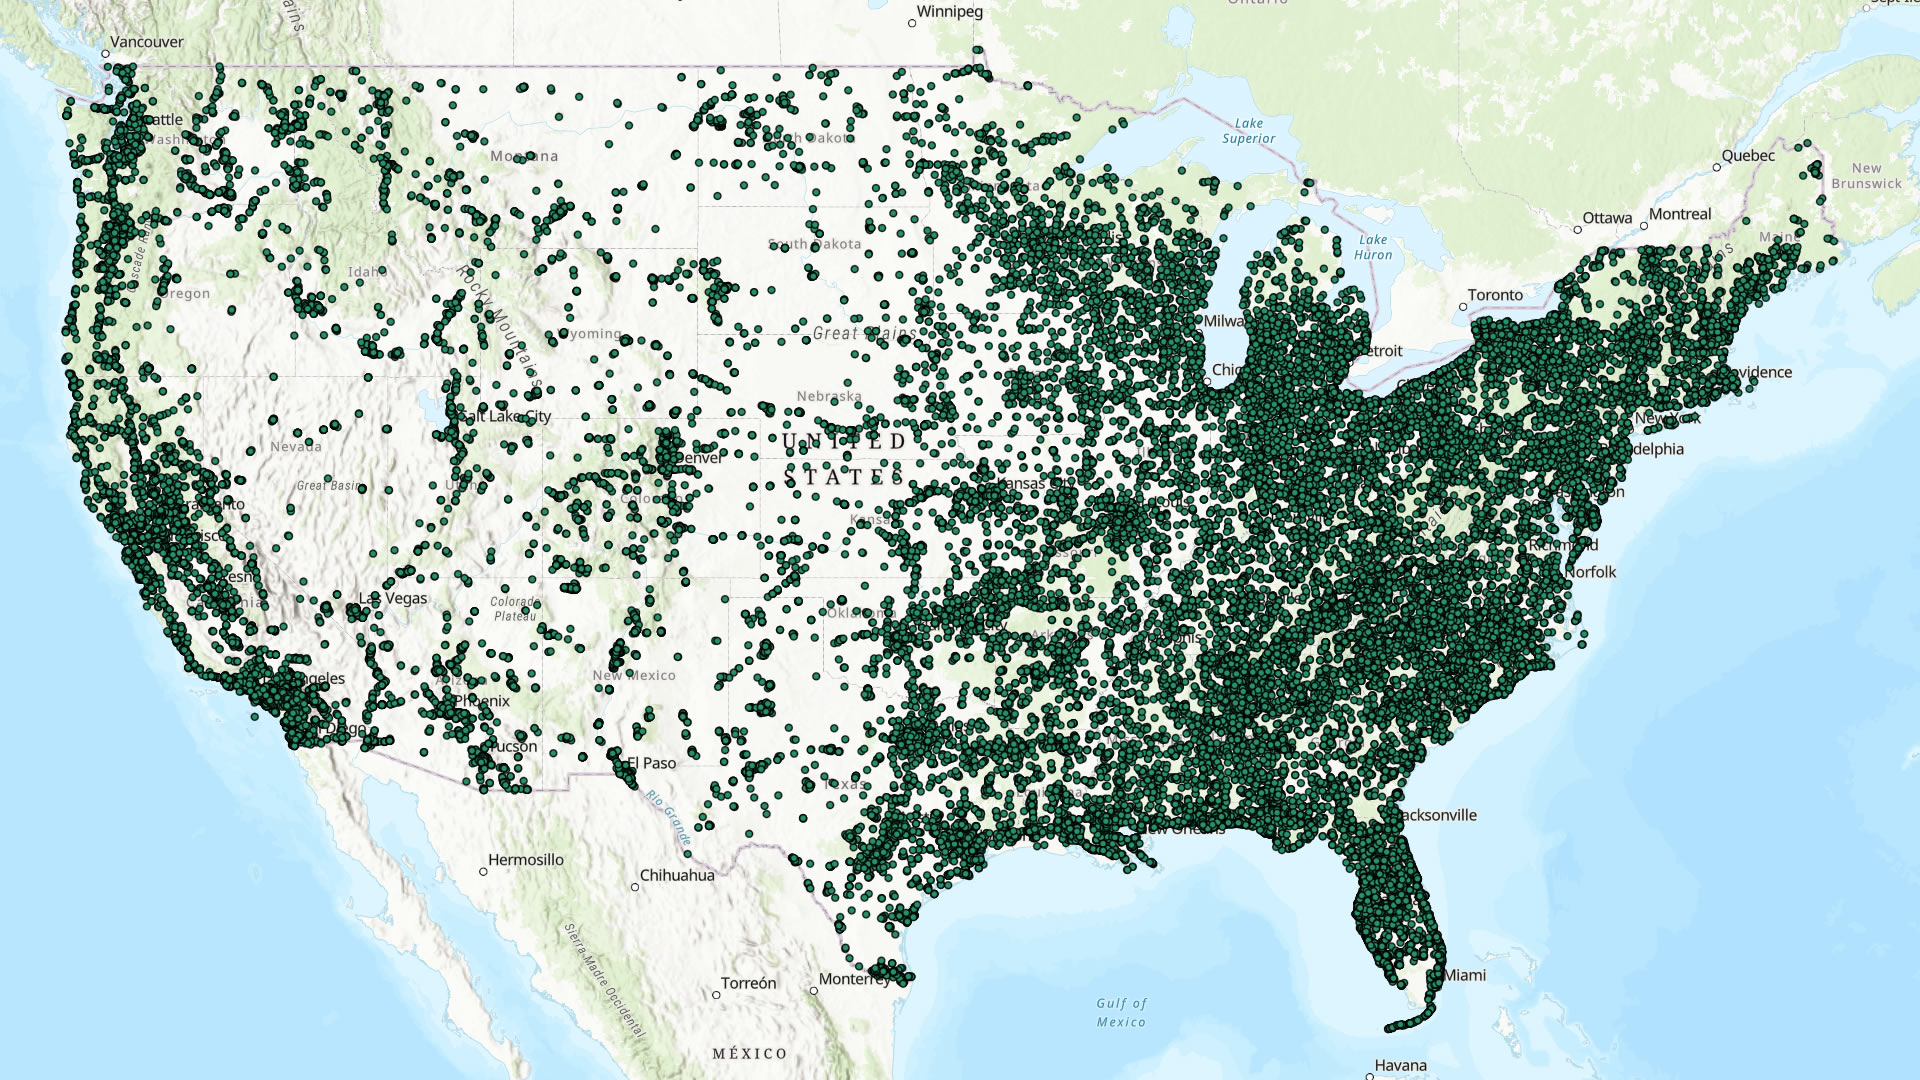
According to data obtained from the U.S. Department of Homeland Security (HIFLD) and as of Tue, Aug 26, 2025, there are 56,094 Mobile Home and RV Parks in the U.S. Top 10 States are highlighted in green.
| # | State | Parks |
|---|---|---|
| Alabama | 2,485 | |
| Alaska | 125 | |
| Arizona | 1,571 | |
| Arkansas | 991 | |
| California | 5,121 | |
| Colorado | 783 | |
| Connecticut | 115 | |
| Delaware | 226 | |
| Florida | 5,926 | |
| Georgia | 1,511 | |
| Hawaii | 0 | |
| Idaho | 533 | |
| Illinois | 854 | |
| Indiana | 1,094 | |
| Iowa | 495 | |
| Kansas | 564 | |
| Kentucky | 929 | |
| Louisiana | 1,842 | |
| Maine | 374 | |
| Maryland | 230 | |
| Massachusetts | 212 | |
| Michigan | 1,104 | |
| Minnesota | 642 | |
| Mississippi | 879 | |
| Missouri | 1,080 | |
| Montana | 642 | |
| Nebraska | 296 | |
| Nevada | 452 | |
| New Hampshire | 322 | |
| New Jersey | 219 | |
| New Mexico | 727 | |
| New York | 1,684 | |
| North Carolina | 3,267 | |
| North Dakota | 307 | |
| Ohio | 1,407 | |
| Oklahoma | 761 | |
| Oregon | 1,022 | |
| Pennsylvania | 1,686 | |
| Rhode Island | 52 | |
| South Carolina | 2,528 | |
| South Dakota | 361 | |
| Tennessee | 1,492 | |
| Texas | 3,682 | |
| Utah | 345 | |
| Vermont | 225 | |
| Virginia | 1,382 | |
| Washington | 1,396 | |
| West Virginia | 801 | |
| Wisconsin | 951 | |
| Wyoming | 401 | |
| Totals: | 56,094 |
| HIFLD Type Breakdown | Parks |
|---|---|
| Mobile Home Parks (MHP) | 53,055 |
| Recreational Vehicle (RV) Parks | 3,039 |
| Totals: | 56,094 |
| HIFLD Size Breakdown | Parks |
|---|---|
| Small – Less than 50 Units | 39,899 |
| Medium – 51 to 100 Units | 9,086 |
| Large – 101 Units or More | 7,109 |
| Totals: | 56,094 |